
Data & Analytics for Clinical Operations
Your trial has a problem. Your dashboard should tell you how to fix it.
Action dashboards for clinical-stage biotechs and small to mid-size pharma. One view of every study, site and participant, across your systems and CROs.
Clinical operations analytics: seeing your trials clearly
Clinical trials run for years, across many countries, sites and partners. Success depends on the science, and on running the study to plan. A delay in site activation, enrollment or data cleaning pushes back database lock, approval and, in the end, patient access. The data to spot these delays already exists. It is spread across CTMS, EDC, IRT, CRO reports and Excel trackers. Clinical operations analytics brings it together, so you see where each study stands at every stage.
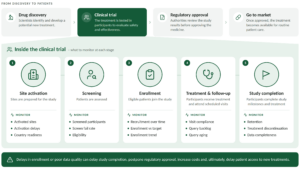
One number does not tell you why
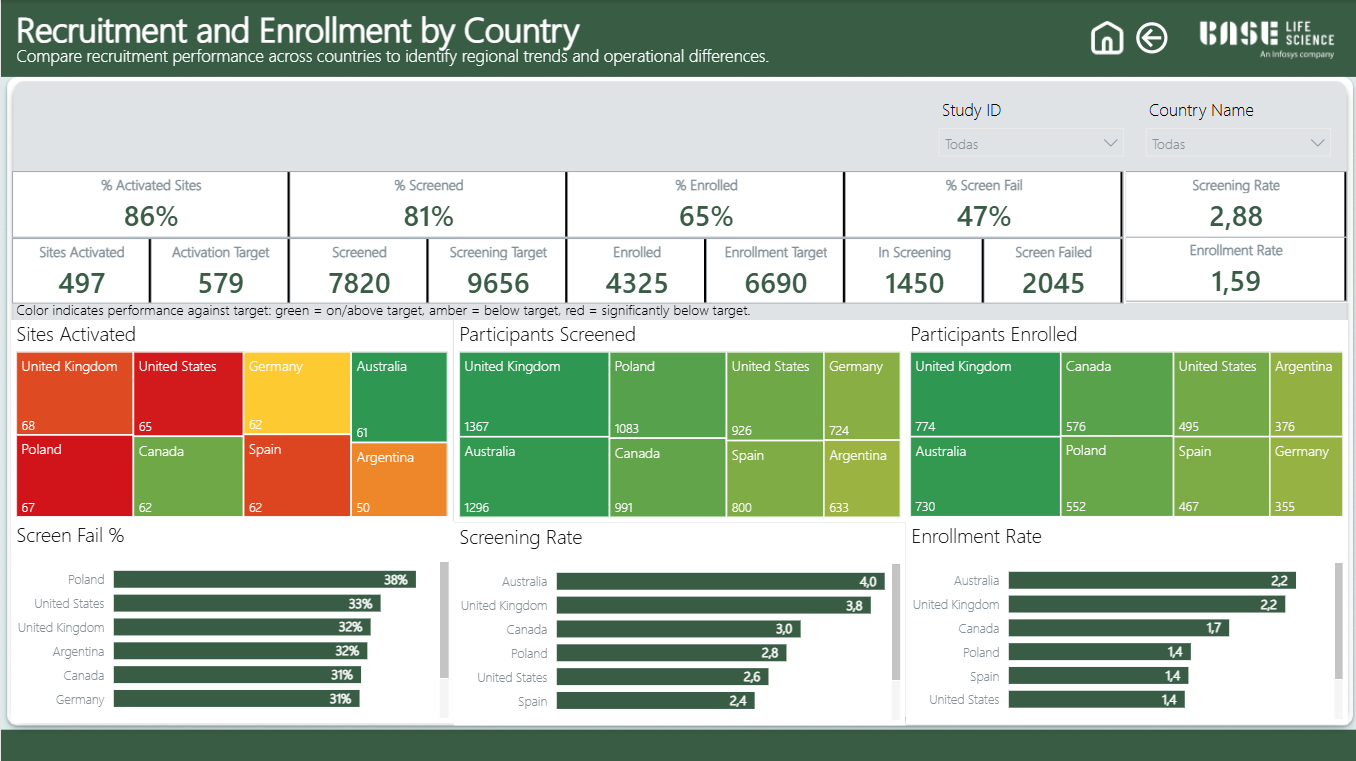
An enrollment percentage tells you a study is behind. It does not tell you why. Is it one country? Sites that are slow to activate? Too many patients failing screening? Or sites that are simply not enrolling? Each has a different root cause, and each calls for a different fix.
See what is off track, and why
Our Clinical Operations dashboards let every team drill down from study to country, site and participant, with every number calculated the same way, so you see what is behind target, why, and where to act.
- One view across all your systems and CROs.
- One library of about 100 KPI definitions, so every number is calculated the same way.
- Start with one module and reuse it for every new study.
A preview of the dashboards
Four views from our demo. Each one answers a question your team asks every week.
STAGE 1 · SITE ACTIVATION
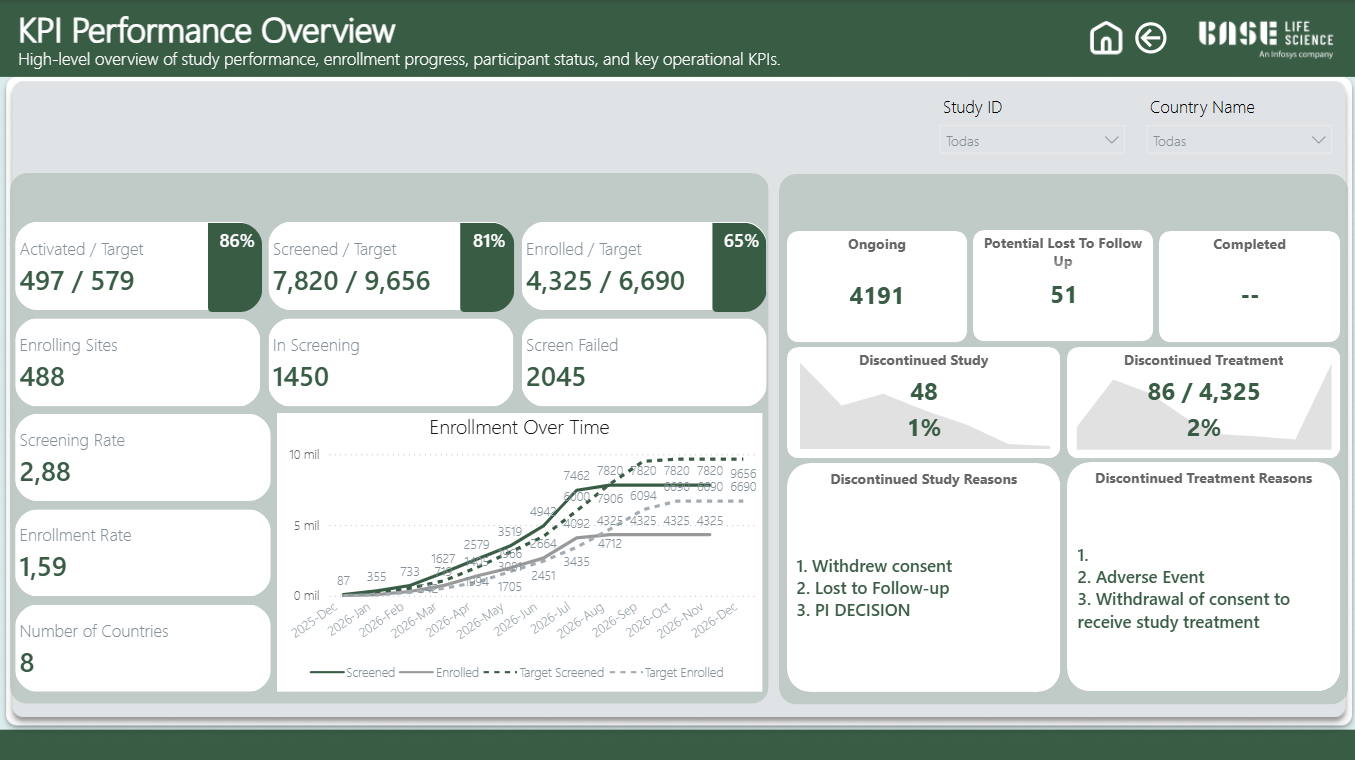
Is the study on track?
One view of activation, screening, enrollment and retention against target.
(KPI Performance Overview. Demo data.)
STAGE 2 · SCREENING & ENROLLMENT
Which countries are behind on recruitment?
STAGE 3 · TREATMENT & FOLLOW-UP
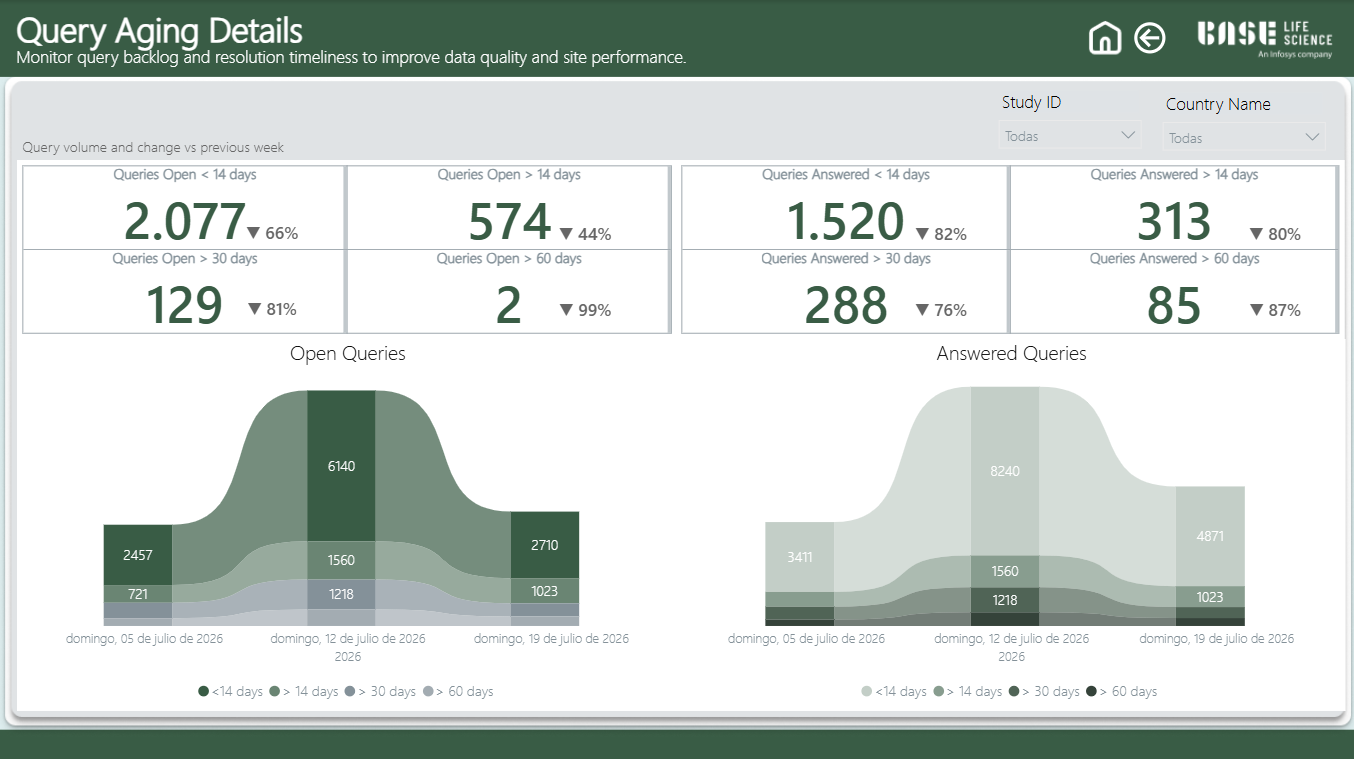
Where is the query backlog growing?
Track open and answered queries by age, and act before they delay database lock.
(Query Aging Details. Demo data.)
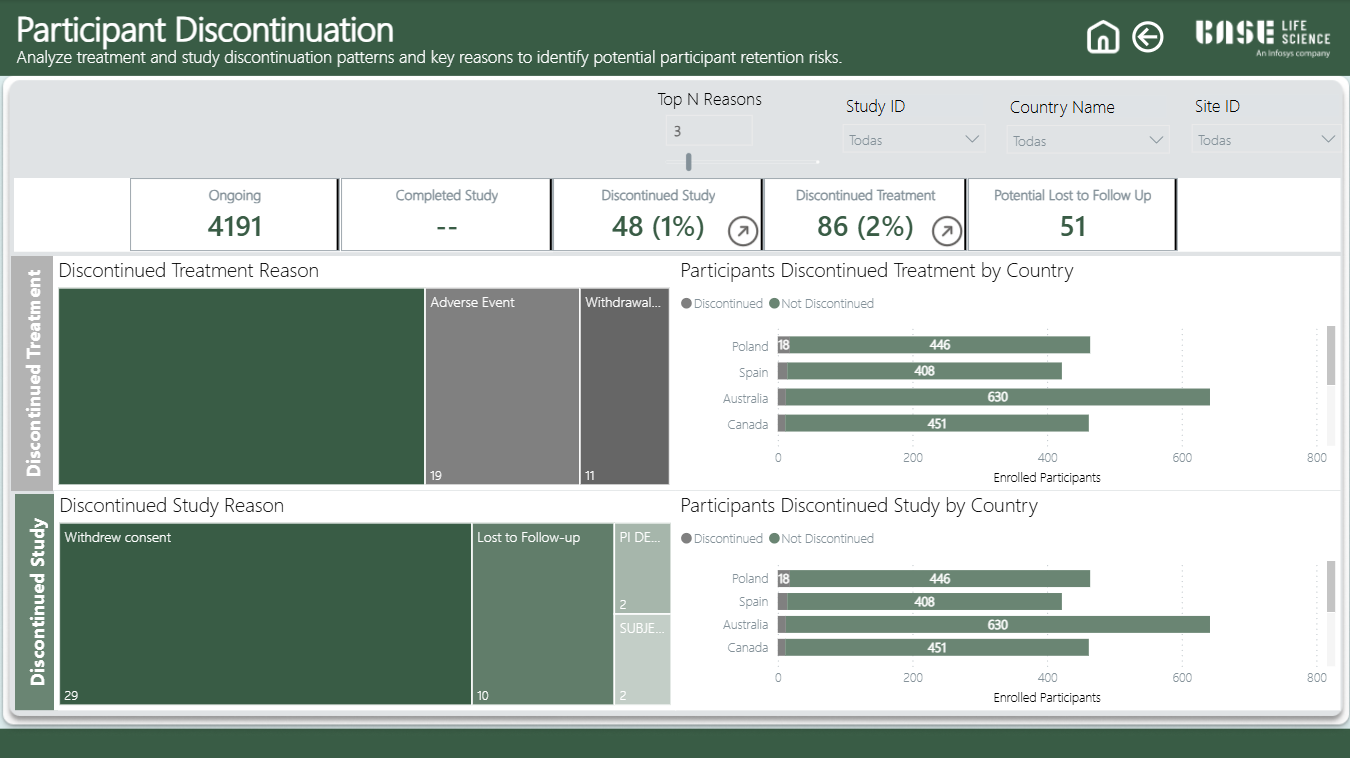
STAGE 4 · STUDY COMPLETION
Why do participants leave the study?
See discontinuation reasons by treatment, study and country.
(Participant Discontinuation. Demo data.)
